
How can we fix the ORC WRS?
If you’ve been involved in offshore racing for a while, you’ve probably come across the new way of calculating results: Weather Routing Scoring (WRS). The idea: combine a boat’s theoretical performance (the VPP polars on its certificate) with a weather model for the actual race, then measure how close each boat got to its possible performance under the conditions.
Sounds good in theory. In practice – as we all know – this is not an exact science. The VPP isn’t really your boat’s true performance, it’s an approximation with some pretty large holes in it. And the weather rarely behaves the way the models think it should.
As the method has become more widely used, we’ve started to see some nasty side effects. At the recent ORC DH Worlds in Scheveningen, several results were very surprising. In Norway, sailors in this year’s Færderseilasen want their money back. There’s been talk of a bug for some time, but ORC has not responded – and as with the XR-41 case, it’s once again the tech-savvy designers and navigators doing the heavy lifting to actually figure out what’s going on.
The deeper question isn’t only the bug. It’s about transparency: should sailors be able to understand their relative rating before, during and after the race? And how much should the race committee’s choice of weather model, routing algorithm and scoring method really affect the result? At some point you have to ask whether a less scientifically ambitious rule that sailors actually understand is the better trade-off.
A small but telling data point from home: our last offshore race at Sandhamn Open. Not a single sailor I spoke to understood the results. And if you re-score the same race with different ORC methods, the order changes a lot – see the table below, scored five different ORC ways. Most boats shift one to four places depending on which method you pick. For a fleet of twelve, that’s not a rounding error – that’s the gap between a podium finish and the back of the pack.
| Pos | Båt | Elapsed | Orig | a) CLD ToT | a) CLD ToD | b) TN Med ToT | b) TN Med ToD |
|---|---|---|---|---|---|---|---|
| 1 | Pro4u | 16:56:12 | 1 | 17:00:52 (1) | −32:15 (1) | 18:34:27 (1) | 55:51 (1) |
| 2 | Blur | 17:00:59 | 3 | 17:19:21 (2) | −13:36 (2) | 18:53:05 (2) | 1:12:03 (3) |
| 3 | Pandion | 15:27:48 | 2 | 17:20:20 (3) | −11:28 (3) | 19:00:43 (3) | 1:11:11 (2) |
| 4 | Oxygen | 15:58:18 | 4 | 17:31:32 (4) | −01:30 (4) | 19:08:37 (4) | 1:19:34 (4) |
| 5 | Joint Venture | 16:04:51 | 5 | 17:35:09 (5) | 01:52 (5) | 19:14:03 (6) | 1:24:22 (5) |
| 6 | AlmaViva | 16:15:25 | 7 | 17:36:51 (6) | 03:18 (6) | 19:14:53 (7) | 1:25:48 (7) |
| 7 | Yrsa | 17:35:28 | 8 | 17:40:31 (7) | 07:21 (7) | 19:18:28 (8) | 1:36:00 (9) |
| 8 | Andiamo | 16:56:12 | 6 | 17:42:20 (8) | 08:38 (8) | 19:09:13 (5) | 1:24:49 (6) |
| 9 | Matador | 14:26:19 | 12 | 17:53:21 (9) | 16:12 (9) | 19:30:23 (9) | 1:26:46 (8) |
| 10 | Heist | 14:44:04 | 9 | 18:06:57 (10) | 27:27 (10) | 19:42:15 (11) | 1:36:26 (10) |
| 11 | The Trooper | 17:21:52 | 10 | 18:08:57 (11) | 34:07 (12) | 19:38:33 (10) | 1:50:50 (12) |
| 12 | Nemo Rosso | 15:00:08 | 11 | 18:14:12 (12) | 33:42 (11) | 19:49:09 (12) | 1:42:51 (11) |
Sandhamn Open Hav, 105.32 NM, originally scored by WRS, comparison to (a) Coastal/Long Distance and (b) Triple Number CLD Medium – both methods in ToT och ToD.. ToD corrected in mm:ss; negative = faster than cert-implied.
To see what this can look like from the inside, here’s what happened to Team Gaia at the DH Worlds – finishing second across the line, scored last in the results. That’s what it looks like from a competing team in the middle of the storm. The frustration is justified . but it doesn’t tell us why the numbers behave the way they do.
For that, Nils Melsom Kristensen has done his homework. He sailed the recent Færderseilasen on the X-41 Saillogic, works as a scientist at MET Norway, and produced the official weather briefing for the event. He has dug into the actual mechanism behind the WRS output – and what he’s found is worth reading carefully.
Over to Nils.
How can we fix the ORC WRS?
by Nils Melsom Kristensen (nilsmk@duck.com)
Weather routing scoring could have been one of the best things that has happened to handicap racing in ages, but unfortunately it seems to be failing. Surprise surprise, it’s not primarily due to unreliable weather models, it’s a fundamental flaw in the weather routing module. Here is my humble attempt at explaining the problem in a way that is understandable to most sailors. All the work below is based on the recent Færder race in Norway.
Disclaimer: I was sailing the race onboard the X-41 Saillogic. I also work as a scientist at MET Norway and produced the official weather briefing for the event, but I am not directly connected to any of the weather models used in the WRS. So even if I might have a personal interest in the case, my only agenda is to fix the WRS, which is currently not working as intended.
To explain this, I will use the case of four X-41 sailing in the same class, same course, same start. Here are some facts about the boats and rating. All percentage differences below use Saillogic as reference.
| Name | Certificate | APH ToT | % diff APH | WRS ToT | % diff WRS |
| BarX | Cert | 1.1863 | -0.8 | 1.0548 | -8.8 |
| Xanadu | Cert | 1.1783 | -1.5 | 1.1369 | -1.7 |
| Saillogic | Cert | 1.1961 | 0.0 | 1.1567 | 0.0 |
| Gottix | Cert | 1.1901 | -0.5 | 1.1337 | -2.0 |
It is expected to have some differences in the rating relatively between boats when moving from APH to WRS, since the polar diagrams are not exactly the same. However, to have One Design boats (like the X-41) with only slightly different sail configurations to change by 8% when moving from one system to another is something that should be grounds for a more thorough examination.
Let’s first look at the measurement certificates (link in table above). The VPP performance number (polars) can be found below.
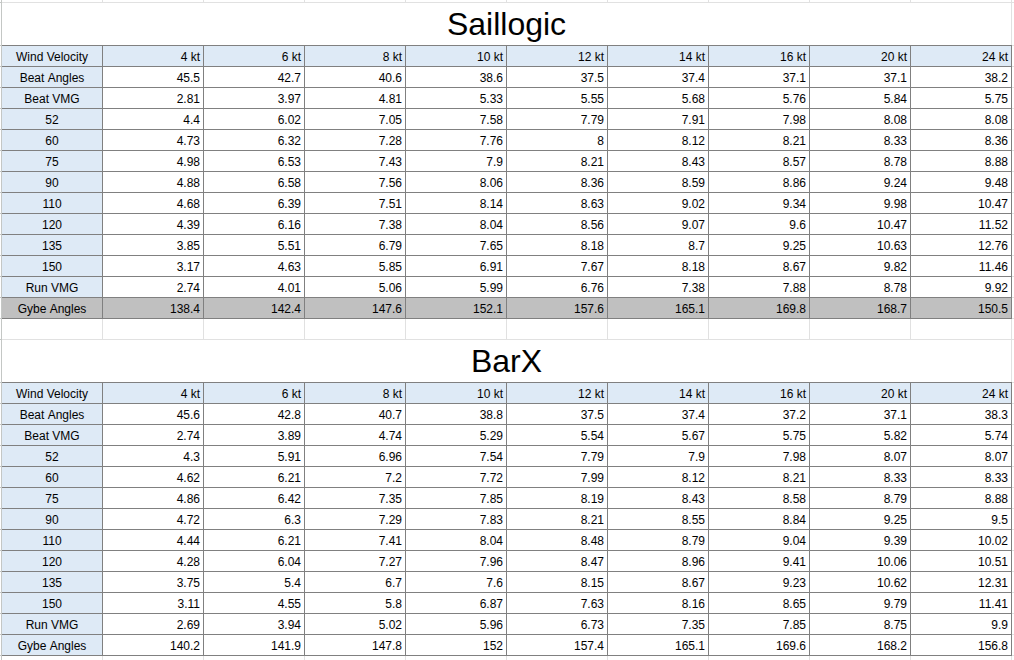
Then, let us compare these two. See both absolute and relative differences in speed in the tables below. Positive numbers means Saillogic is faster, negative numbers means BarX is faster.

As we can see, Saillogic is generally faster than BarX, which is also expected since the APH of BarX is 0.8% less than Saillogic. The largest relative difference in predicted speed is 8.8%. This is reaching in 24kt TWS. The Færder race saw a maximum wind of about 16kt for a few hours, while the boats were sailing upwind or very tight reaching at TWA 50-90 deg.
According to the WRS routing prediction for Saillogic, the maximum wind used is 10.4kt. For BarX, the maximum wind is 10.1kt.
Then, looking at the relative differences in less than 10kt TWS above, we see the maximum difference is 5.1% in 4kt TWS.
Again looking at the WRS prediction, we see both boats should spend no more than about 2 hours in wind below 5kt, and when taking into account that the predicted total sailing time for Saillogic is about 16 hours, and BarX about 17.5 hours, this accounts for very small parts of the race, and no difference in performance between the boats for the wind range used in WRS is remotely close to the 8.8% difference in rating.
So, let us continue the search.
As was said during the official weather briefing, the weather was very uncertain due to the passing of a small local low pressure system that was passing over the race course during the race. In hindsight, the weather development was very close to the latest forecast that was used in the WRS scoring for the race. The low probably passed a bit further south than expected, giving a more stable breeze than expected, but directions were very close to the forecasted weather. It is common knowledge that forecasting weather is not a precise science due to a number of reasons, something every meteorologist is open and honest about. However, the forecast was generally in good agreement with the actual weather for the race. And, the real weather has no impact on the rating we have discussed so far…
There is no perfect forecast, no perfect weather routing, and no perfect rating system, but the WRS should theoretically be one of the better “simple” systems we can come up with, and it is therefore very surprising that the rating behaves so unpredictable.
Let us dig deeper…
If we look at the WRS output for the Færder race, and the four X-41’s, we can view their predicted courses in the map below.
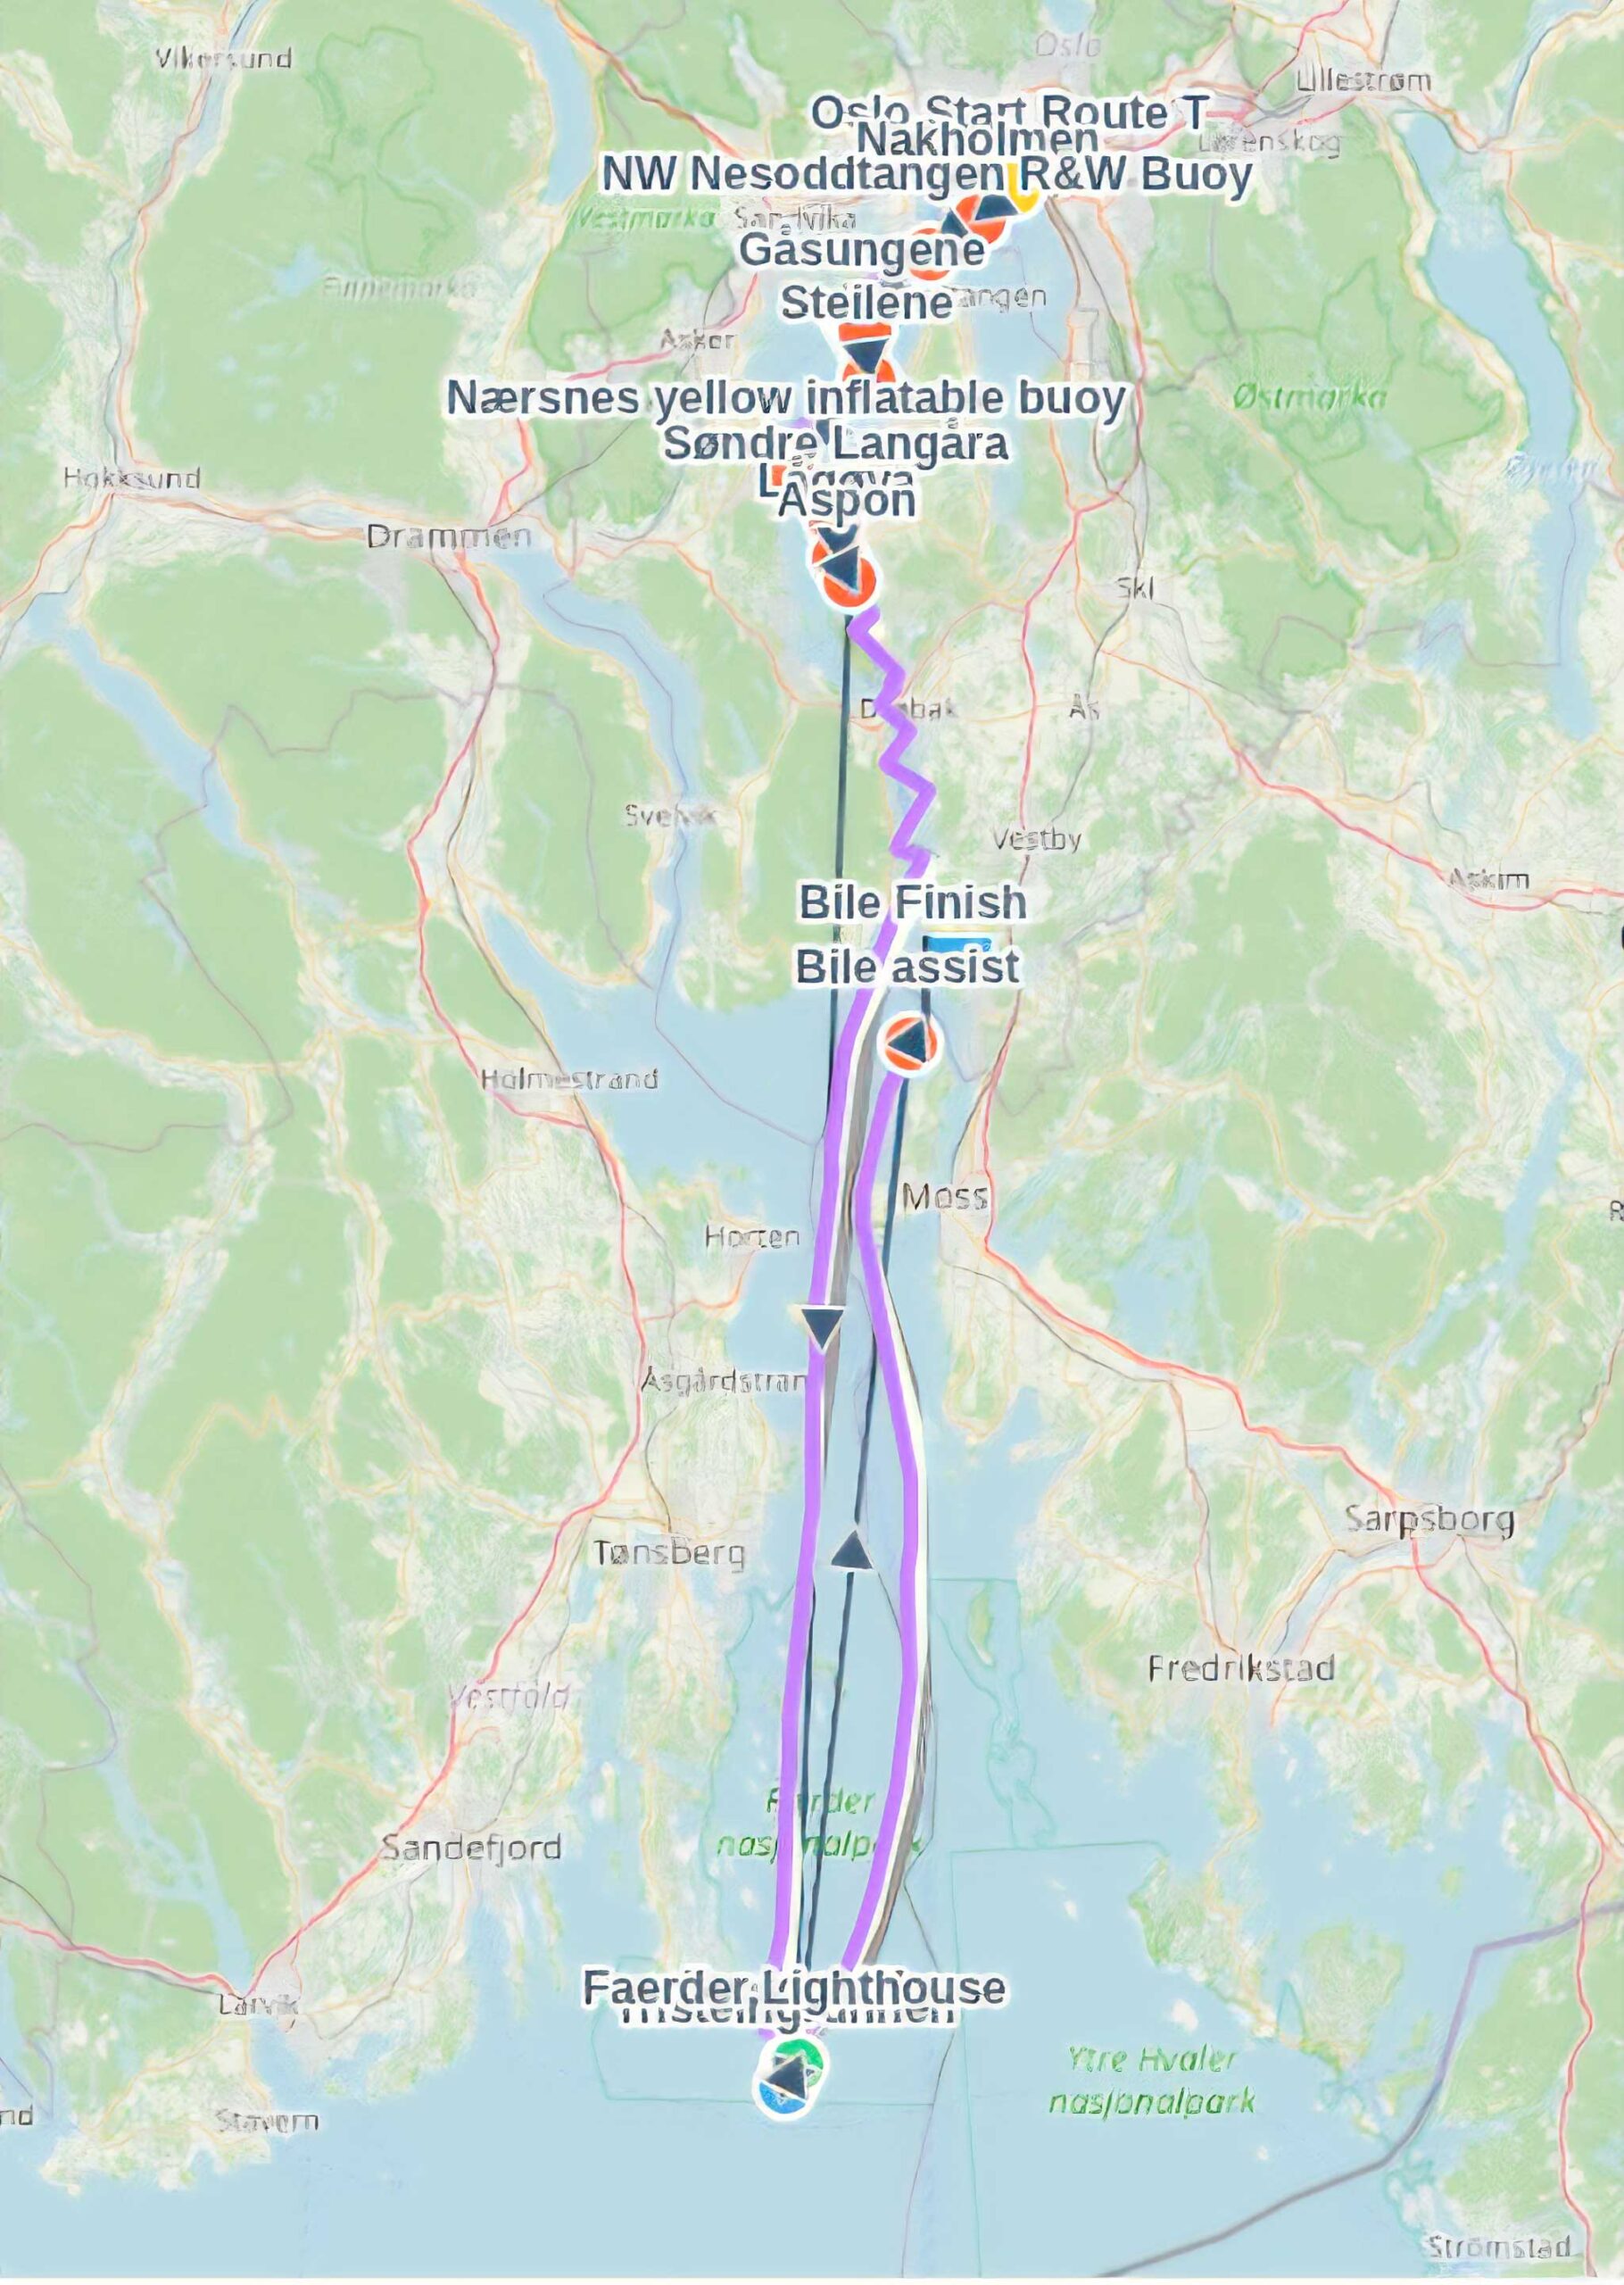
Unfortunately, there is a lot of clutter from the mark names, but trust me when I say that the predicted optimal routes align very well.
So, why would the WRS predict that almost identical boats, sailing the same route, in the same wind perform so differently?
If we zoom in on the predicted routes, we see something strange. This is the crux of the matter. We can clearly see that the wind barbs are placed at different positions along the optimal routes. When using a grid-based routine algorithm, these wind barbs are usually placed at the start and end of the route segments, so we assume the same is the case here. In the example below, I have zoomed in on the part of the course between Moss and almost Færder. Now, take a close look at the “brownish” optimal route, and then the white, light grey and purple. The routes on the left are the ones going south, while the ones on the right are the ones returning north. On the southward routes, there are clearly very few wind barbs on the brown route. In fact, going south in this area, I can only spot two (I tried to mark them with red dots), whereas the purple have at least eight.
Why does this matter, you say? Well it does. The wind at the start and end of the routing segment is the wind used to calculate the time spent for that segment based on the boat’s performance prediction. Either the wind at the start of the segment is used on the entire segment, or the wind is linearly interpolated between the two.
If the wind was stable, and did not change in time or space, then it would not matter how many of these routing points you had, since the sum of the predicted times for each segment would be the same as the value for the very long segment. But when the wind is changing, we get a kind of aliasing that would give a different sum of time for the same route depending on where, and how many routing segments you have. See a simplified example in the appendix below.

Brown: BarX, Purple: Xanadu, White: Saillogic, Light grey: Gottix
This type of behaviour in the routing algorithm is common knowledge among offshore navigators who use grid based routing software. When these long jumps occur, it is common to make small changes in the routing settings to try to avoid them. Why they happen, I don’t really know, but I guess there is a bug somewhere… As far as I know, these jumps do not appear commonly in isochronal based routing algorithms.
So, where do we go from here, how do we fix it? Well, only the provider of the routing can do that, but they should start by ensuring that the routing segments have a more evenly distributed length, and that they are not too long. Additionally, it would be wise of the ORC to admit the problem, and how this may have influenced the results of races that have been scored using WRS.
As I final note, even if I am very certain that this is the problem, I can be wrong, and I am definitely open to other explanations if anyone has one.
Appendix
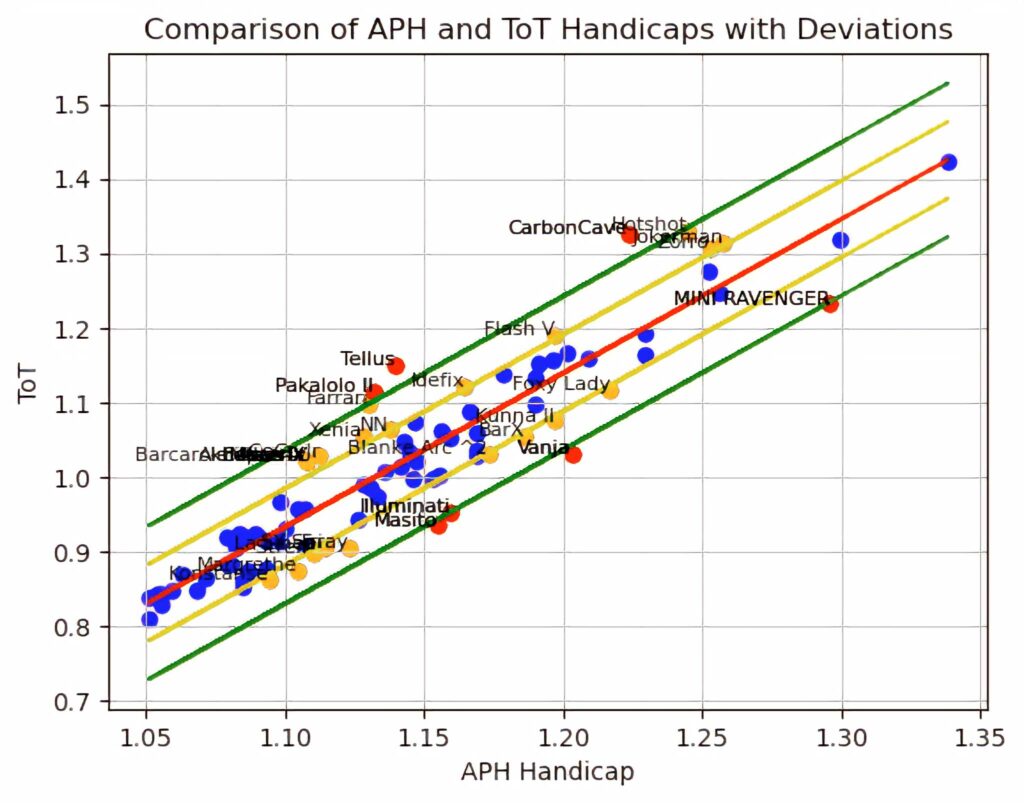
Comparing the yachts that sailed the longest course, APH on x-axis, WRS on y-axis. Red line is linear regression, while the yellow are +/- 1 standard deviation and the green +/- 2 standard deviations. Yachts that fall below the red line have “better WRS than APH” , while the yachts above the red line “have worse”. Boats in blue generally behave as expected, while the red and orange are some that should be looked into.
Overall, it is expected that relatively similar boats that are considered “all-round boats”, should have a similar relative relation between them if it is APH or WRS.
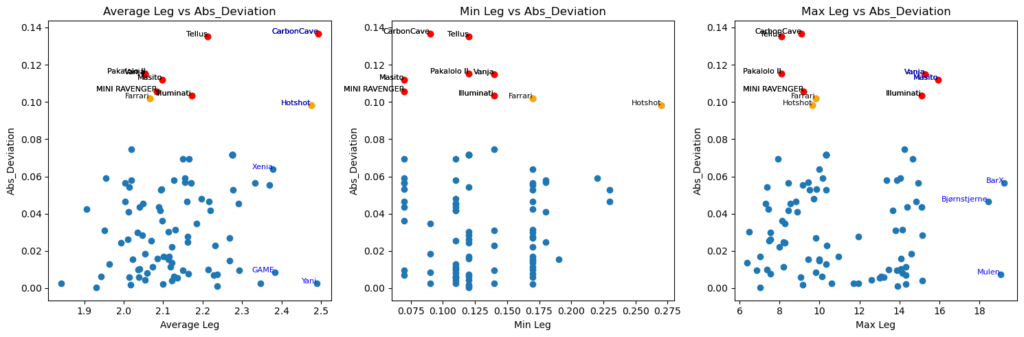
Average leg length (of the predicted route) vs absolute deviation from the regression line, minimum leg length vs abs_deviation and maximum leg length vs abs_deviation. See e.g. BarX has the longest leg of all yachts, over 18nm on a 88nm race…


2026-06-17 @ 14:21
Segling är en sport som ibland är svår att förstå. Om resultatberäkningarna blir ännu svårare att förstå för all inblandade och dessutom inte känns rättvisa är det väldigt negativt för att främja sporten. Var det inte så att förra årets Gotland runt även använde WRS där detta gjorde att 1:an och 2:an skiftade plats beroende på om man hade användt tidigare system eller WRS?
2026-06-17 @ 14:46
En diff mellan båtarna på Faerdern på 20% i diagrammet på performance i APH vs WRS verkar ju helt galet…
Som sagt, blir det för vetenskapligt komplex, ändå inte mer ”rättvist”, helt icke-transparent och väldigt svårbegripligt och med långsam resultatredovisning, så riskerar vi verkligen att mycket snabbt accelerera en redan negativ trend för deltagande i kappseglingar.
2026-06-17 @ 22:41
Why does ORC partner with Predict Wind – that creates another unnecessary black box (and dependency). Instead, WRS should be made with an open source weather routing algorithm. RCs should have to publish the weather model and all parameters used.
2026-06-18 @ 12:10
Just to clarify the main finding of my work: Due to different discretization of the routes for different (or almost identical) yachts in a race scored using the WRS, the routing algorithm influences the rating. It’s like calculating identical yachts on slightly different wind models. Weather model forecast error is another discussion, but it is not relevant yet, since the errors we are discussing now has nothing to do with forecast error. It is simply a numerical effect.
If the ORC does not acknowledge this, and ask the routing provider to fix it, they are effectively throwing the baby out with the bathwater. It’s like saying that errors in the VPP are not important, because, in the end, there is no perfect truth.
There is no such thing as a perfect rating system, but ignoring large errors in the system when they are pointed out, is, at best, just ignorant…
I have been sailing handicap races scored on IMS and ORC for more than 30 years, and have gained insight and trust in the system over the years, and in my opinion, it is the best rating system that exist. But I think what we see now could very well be the start of the end for at least the WRS, if not the entire ORC rule, if we don’t see an effort from the ORC to accept the problem, and come up with a public admission and plan for a fix…
But, hey, I’m just a simple guy, sailing because I think it’s fun, so what do I know :P
2026-06-25 @ 13:34
Har nyligen följt ett av USA´s större event i form av Newport – Bermuda där man tycks ha använt ett handicap-system som också det bygger på omräkningar mot en väderprognos. Tydligen räknade man fel och resultatlistan fick korrigeras enligt meddelandet nedan. Som sagt var är det nära nog omöjligt att veta hur man placerat sig förens komplicerade beräkningar är gjorda…
Notice to Fleet: Corrected Results Posted
Number 13
issued June 24, 2026 at 14:59
Notice to Fleet Corrected Results Posted
Thank you for your patience as we worked through the Forecast Time Correction Factor (FCT-F) scoring issue identified in the preliminary results.
Since this morning, the Bermuda Race Organizing Committee (BROC) has been working closely with the third-party providers involved in generating the FCT-F calculations, including the US Sailing Offshore Office and Expedition. Together, they identified the discrepancies, re-ran the calculations for every boat individually, and verified the corrected results.
The corrected results are now available at bermudarace.com/results. This issue was unrelated to the race management system and scoring platform powered by Nautical Cloud. Rather, it originated in the FCT-F calculations that were generated prior to being imported into the scoring system on Friday morning. Through the investigation, it was determined that an issue existed within Expedition’s fleet-processing mode that resulted in incorrect calculations for a number of boats. Once the anomalies were identified, the US Sailing Offshore Office re-ran the FCT-F calculations for every boat individually and verified the results.
While it is unfortunate that this issue was not identified prior to the publication of preliminary results, we appreciate the efforts of the US Sailing Offshore Office and Expedition in quickly identifying the source of the problem and working diligently to verify corrected calculations for the entire fleet. We would also like to thank Nautical Cloud for its assistance in promptly updating and publishing the corrected results once the verified calculations were provided.
As a result of these corrections, some standings have changed from those reflected in the preliminary results.
At the end of the day, we thank all competitors for their patience, understanding, and cooperation throughout this process. Most importantly, we congratulate every sailor who successfully completed this year’s Newport Bermuda Race and navigated the challenging conditions on the passage to Bermuda.
BROC will continue to work with its partners to better understand how this issue occurred and to ensure the integrity and accuracy of future scoring processes.